The 2025 Arab Opinion Index is the product of the ninth round in a series of public opinion surveys conducted across the Arab world by the Arab Center for Research and Policy Studies since 2011. Following a year of preparation, the fieldwork for the 2025 Arab Opinion Index was conducted between November 2024 and August 2025 in 15 Arab countries: Algeria, Egypt, Iraq, Jordan, Kuwait, Lebanon, Libya, Mauritania, Morocco, Palestine, Qatar, Saudi Arabia, Sudan, Syria, and Tunisia. Sampling in all countries surveyed followed a randomized, stratified, multi-stage, self-weighted, clustered approach. The survey considered dimensions such as urban versus rural areas and top-level administrative divisions in each country according to the relative weight of each demographic stratum, such that each respondent had an equal probability of inclusion in the sample, giving an overall margin of error of ±2–3 percent across all countries. The sample was designed such that results may be analysed based on the regions, provinces, and principal administrative divisions of all surveyed societies.
The survey consisted of face-to-face interviews with a sample of 40,130 respondents, making the AOI the largest public opinion survey in the Arab world. A team of 1,000 researchers, equally balanced in gender, used 413,000 hours of work to carry out these surveys. The team covered a total distance of over 620,000 miles. The results of the index for the 15 surveyed countries represent a general average for all countries of the Arab world, which is calculated by assigning equal weight to public opinion in each state without distinction (i.e. instead of using the weight of each state relative to its population, all states are treated as similar units within the same population). This approach avoids bias toward countries with larger populations in calculating overall public opinion.
The results of the index are presented according to the countries surveyed and the general average of the Arab world. For the purposes of comparison, data from the surveyed countries is classified according to the geographic regions of the Arab world, namely: The Arab Maghreb (Algeria, Mauritania, Morocco, Libya, Tunisia), the Nile Valley (Egypt, Sudan), the Arab Mashreq (Iraq, Jordan, Lebanon, Palestine, Syria), and the Arab Gulf (Kuwait, Qatar, Saudi Arabia).
Table of Contents
- Section I: Living Conditions of Arab Citizens
- Section II: Perceptions of State Institutions and Governmental Performance
- Section III: Arab Public Opinion and Democracy
- Section IV: Civic and Political Participation
- Section V: Gaza, Lebanon, Sudan, and Syria
- Section VI: The Palestinian Cause and the War on Gaza
- Section VII: Arab Public Opinion on Intra-Arab and International Relations
- Section VIII: Public Opinion on the United States
- Section IX: Internet and Social Media
- Code Book and Data
Section I: Living Conditions of Arab Citizens
How do Arab citizens assess their economic conditions?
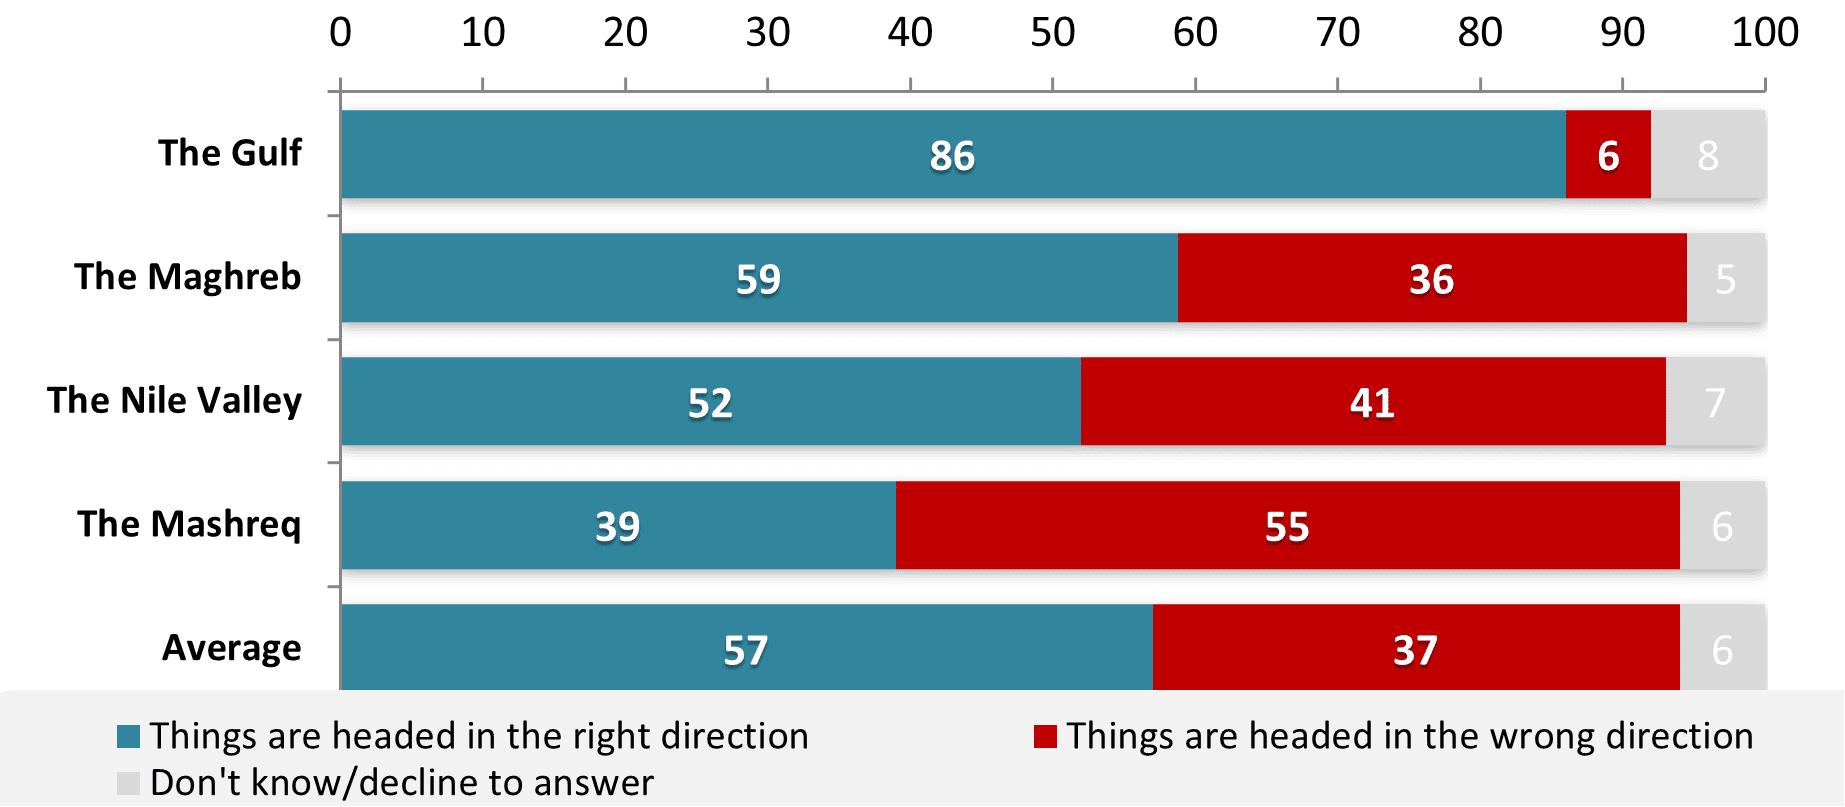
- Fifty-seven percent of respondents believe that their countries are headed in the right direction, compared to 37 percent who say they are headed in the wrong direction.
- Forty-three percent of those who said they were going in the wrong direction blamed economic causes, whereas 14 percent cited unfavorable political conditions, such as political confusion and the failure of the political system to function as it should. Nine percent stated that the reason is poor state management and policy, and seven percent indicated a general lack of stability.
- Meanwhile, 83 percent of those respondents who answered that their countries are headed in the right direction provided the following reasons: 19 percent stated that the conditions in the country had improved, while 15 percent attributed their answer to the security and safety in their countries, 13 percent to good governance, 7 percent to an improvement in the economic situation, 5 percent to political stability, and another 5 percent to a sense of optimism about the future.
- Only 26 percent of respondents, mostly in the Gulf region, reported that their household income was sufficient to make savings after covering necessary expenditures. A further 41 percent reported that while their household income was sufficient to cover necessities, they were unable to save. Twenty-eight percent of respondents reported that their families were experiencing poverty, with household incomes not covering necessities. It is important to note that there is a significant gap between the Gulf states and other countries (especially the Mashreq) when it comes to the percentage of families experiencing poverty.
- Thirty-one percent of families in need resort to borrowing from family and friends, with 16 percent receiving assistance from friends and neighbours while 12 percent take loans from banks and financial institutions.
- Seventeen percent of families in need rely on institutional aid, whether from charitable, governmental, religious, or civil associations, while 10 percent resort to selling their assets. This means that the frameworks of traditional social solidarity are still stronger than the framework of institutional aid.
Figure 1: Regional comparison of respondents’ assessment of how things are heading in their countries
How do Arab citizens assess the political and security situations in their countries?
- Sixty-three percent of respondents rated security in their country positively, compared to 34 percent who rated it negatively. As expected, a majority of Sudanese, Syrian, and Palestinian respondents indicated that security in their country was poor.
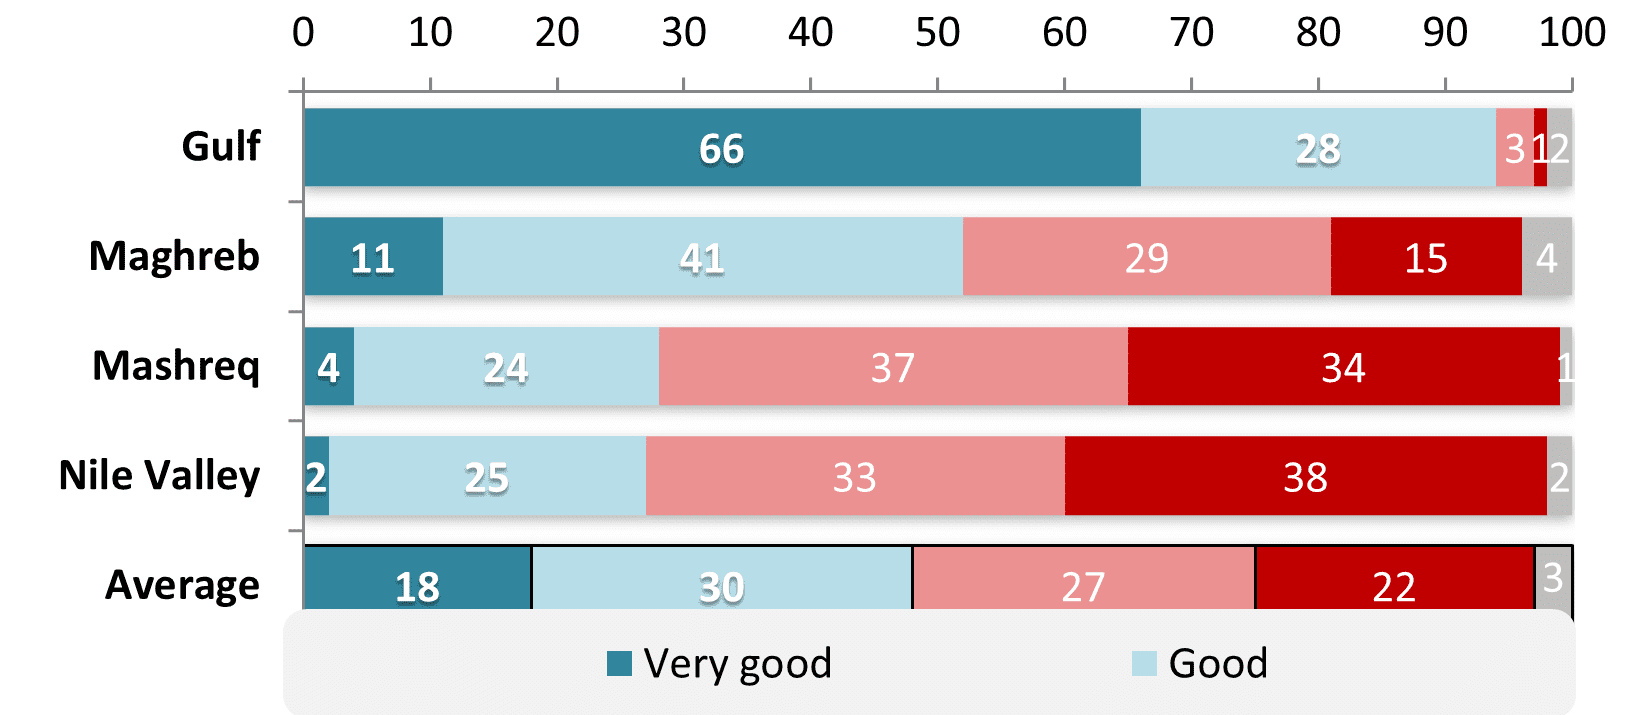
- While 48 percent described the economic situation of their countries as good, 49 percent judged the economic situation of their countries as negative overall. The majority of respondents, with the exception of the Gulf countries, Algeria, and Mauritania, evaluated the economic situation in their countries negatively, especially in the countries of the Mashreq.
Figure 2. Regional comparison of respondent assessments of the economic situation in their countries
- Fifty-five percent of respondents evaluate the political situation in their countries positively, compared to 38 percent who see it negatively. Most respondents in the Gulf states judged the political situation positively.
What are the priorities of Arab citizens?
- The priorities of the citizens of the Arab region vary, but the largest bloc (60 percent) specified priorities of an economic nature. More than half of the citizens listed unemployment, high prices, poor economic conditions, and poverty as the most important challenges facing their country.
- Twenty-two percent of respondents indicated that their priorities relate to security, safety, and political stability.
- Of the 25 percent of respondents expressing a desire to emigrate, the majority were motivated by the desire to improve their economic situation while 18 percent cited political or security reasons. Fourteen percent of respondents wishing to emigrate indicated that their motivation was education or educational stability.
- More than one third of respondents in the Mashreq and Nile Valley and nearly one third in the Maghreb wish to emigrate, compared to 8 percent in the Gulf. Fifty percent of respondents in Sudan indicated they wish to emigrate from their country.
Figure 3. Longitudinal comparison of desire to emigrate
- While public opinion varies across countries on the question of which states pose the greatest threat to the security and stability of the Arab world, Israel holds first place as the greatest threat to the region; 28 percent of the public believe that Israel is the most threatening to the security of their countries, while 10 percent point to the United States of America as the source of the threat, and 8 percent Thirty-five percent of Kuwaitis cite Iran as the main security threat.
- Fifty-three percent of the respondents in the Mashreq said that Israel is the main threat to their countries, compared to 38 percent in the Nile Valley region.
- Nine percent of Gulf respondents said that Israel is the main threat to their countries, whereas 14 percent cited Iran.
Figure 4. Greatest sources of threat to the security of the respondents’ countries
| Mashreq | Nile Valley | Maghreb | Gulf | Average | |
| Israel | 53 | 38 | 9 | 9 | 28 |
| United States | 16 | 6 | 6 | 7 | 10 |
| Iran | 16 | 1 | 1 | 14 | 8 |
| Neighboring or regional Arab states | 2 | 1 | 11 | 5 | 6 |
| Gulf states | 0 | 33 | 1 | 0 | 5 |
| France | 0 | 0 | 6 | 0 | 2 |
| Mali | 0 | 0 | 4 | 0 | 1 |
| Türkiye | 2 | 1 | 2 | 0 | 1 |
| Neighboring or regional non-Arab states | 0 | 3 | 1 | 0 | 1 |
| Arab states | 0 | 2 | 1 | 0 | 1 |
| Ethiopia | 0 | 5 | 0 | 0 | 1 |
| Russia | 1 | 1 | 1 | 0 | 1 |
| Other | 0 | 0 | 2 | 0 | 0 |
| Don’t know/decline to answer | 7 | 7 | 47 | 42 | 27 |
| No threat | 3 | 2 | 8 | 23 | 8 |
| Total | 100 | 100 | 100 | 100 | 100 |
Section II: Perceptions of State Institutions and Governmental Performance
How confident are Arab citizens in their state institutions?
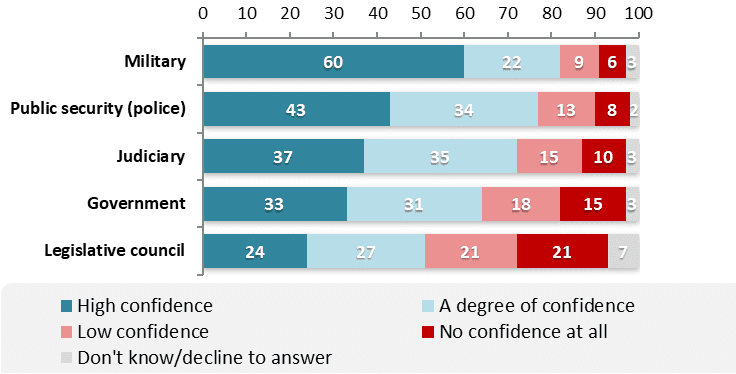
- Confidence of Arab citizens in their state institutions varies: while confidence is especially high in the military, public security, and judicial institutions, confidence in executive and legislative branches is low. Confidence was lowest in parliaments/legislative councils.
Figure 5. Citizen confidence in principal state institutions (general average)
How do Arab citizens evaluate government performance?
- Evaluation of governments’ performance at the level of foreign policies, economic policies, and a range of public policies and services, is generally not positive.
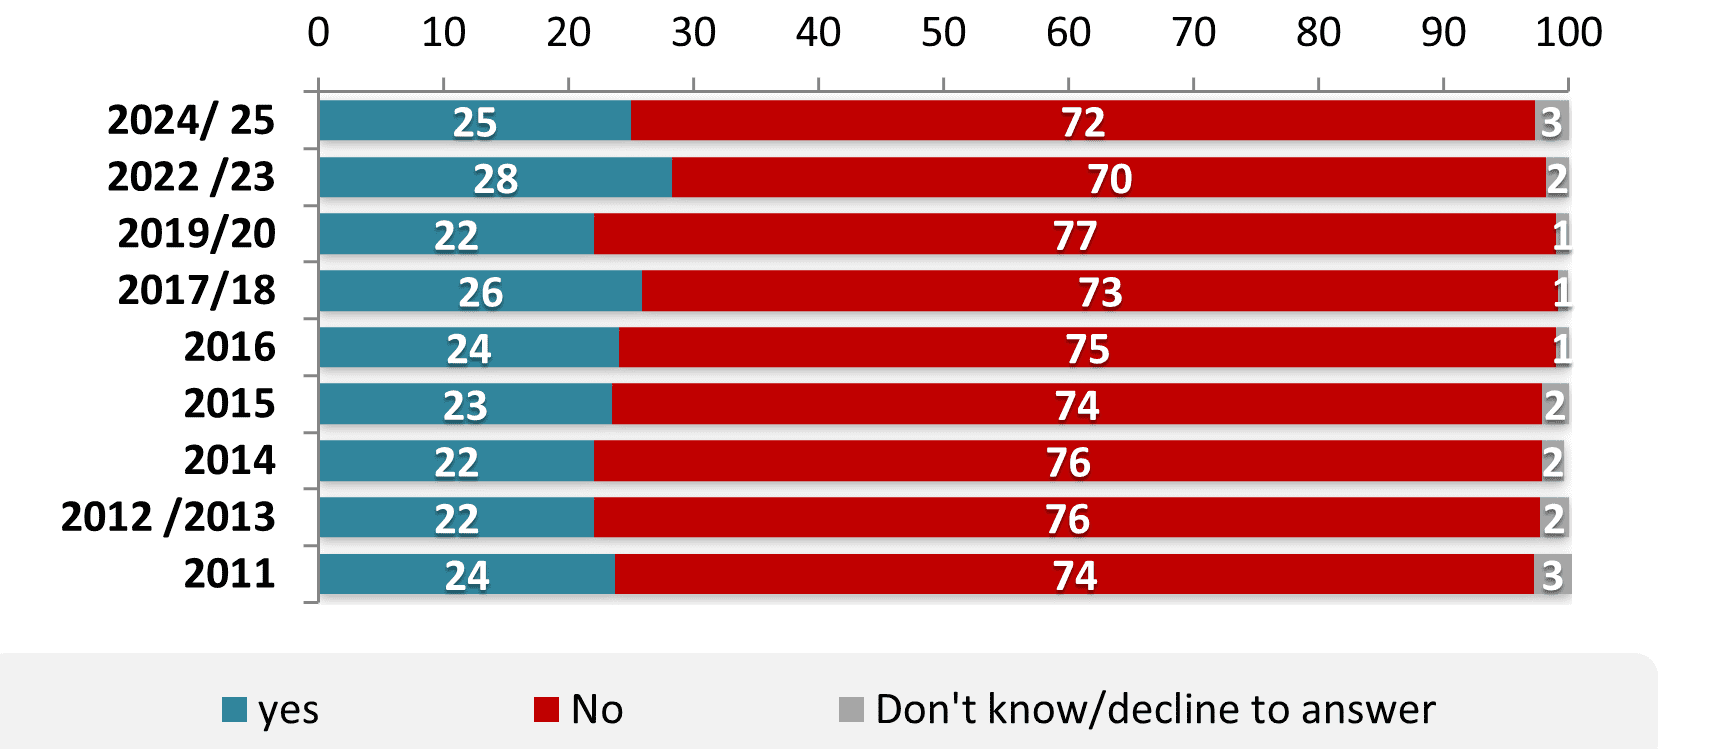
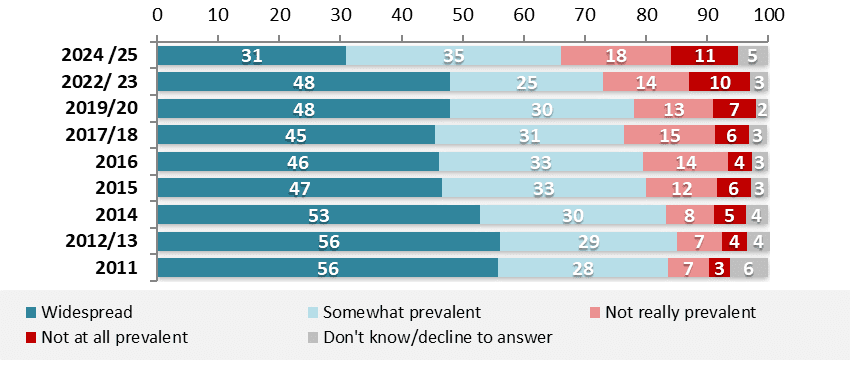
- There is a clear consensus that financial and administrative corruption is widespread across Arab countries: 84 percent of the Arab public believes that corruption is prevalent to varying degrees in their home countries, compared to only 11 percent who believe that corruption is not at all prevalent. Data over the course of nine survey rounds since 2011 indicates that citizen perceptions of the extent of corruption in their countries have not changed substantially. However, in recent years a substantial decrease has been observed in the number of respondents who believe corruption is widespread compared to those who believe it is only somewhat or slightly prevalent. Respondents in the Mashreq countries are most convinced of the spread of corruption in their countries, while the highest rates of citizens who do not believe that corruption is widespread were recorded in the Gulf countries.
Figure 6. Longitudinal comparison of public opinion on the prevalence of financial and administrative corruption in respondents’ countries
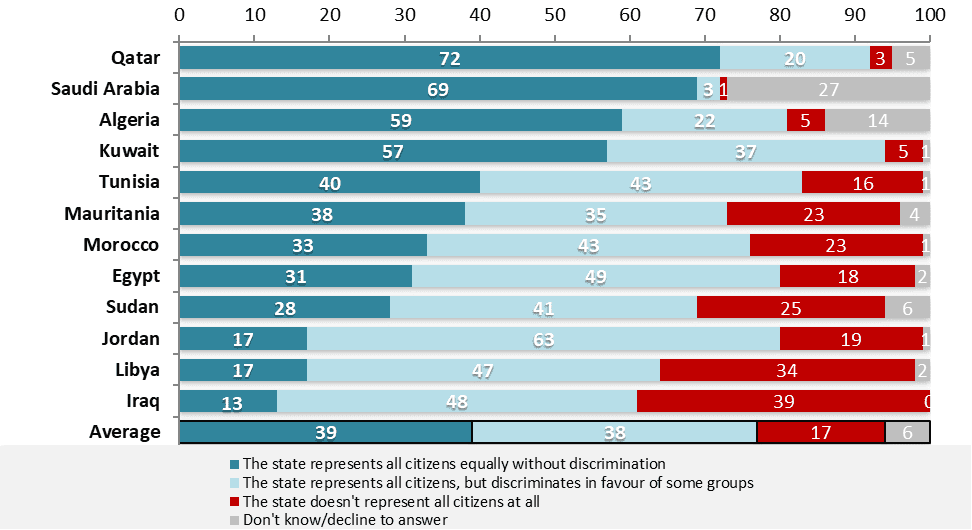
- Forty percent of respondents said that their state enforces the law equally among its citizens, while 37 percent think that it favors certain groups (i.e. discriminates according to their interest) and 18 percent believe that it does not apply the law equally at all. This question was not asked in Palestine, Lebanon, or Syria.
Figure 7. Longitudinal comparison of respondent assessments of the extent to which the state enforces the law equally
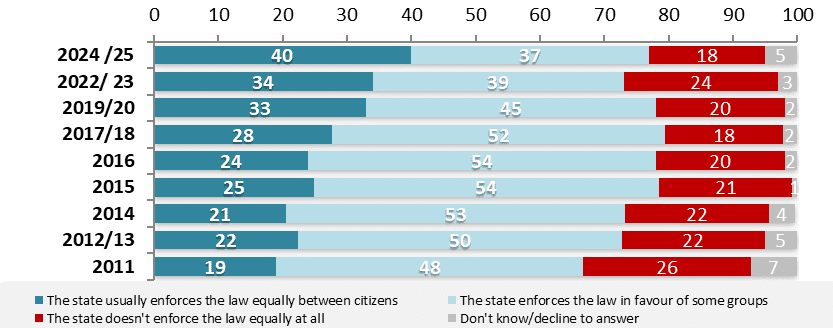
Figure 8. Regardless of the extent to which you agree or disagree with current government policies, which of the following statements best expresses your perspective on the state in your country?
Section III: Arab Public Opinion and Democracy
How do Arab citizens understand democracy?
- Eighty-three percent of citizens of the Arab region are able to provide a substantial definition of democracy.
- Thirty-four percent define democracy as a guarantee of political and civil freedoms. Twenty percent said that democracy is a guarantee of equality and justice among citizens, while 14 percent focused on participation and the institutional aspect of a democratic system (circulation/transfer of power, separation and control between the authorities), six percent defined democracy as a guarantee of security and stability, and five percent defined it as improving economic conditions.
- The results show an increase in the percentage of those who defined democracy as participation and the institution of democratic governance (circulation, separation, and oversight between authorities), especially in countries such as Egypt, Kuwait, Mauritania, Morocco, and Sudan.
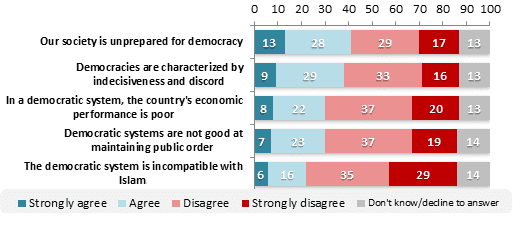
- The majority of Arab citizens reject negative statements about democracy, but they are divided on the statement “Our society is unprepared for democracy.” Opinion is also somewhat divided about the statement “Democracies are characterized by indecisiveness and discord.”
Figure 9. Respondent views on statements about the democratic system
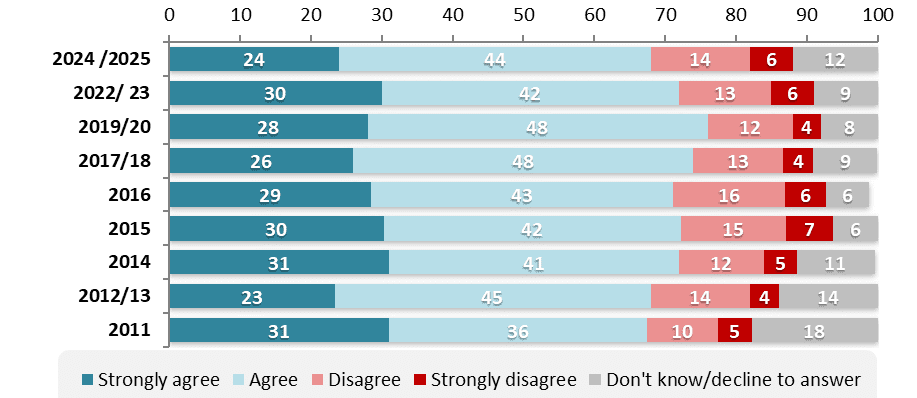
- A majority of citizens, 68 percent, supports the democratic system while only 20 percent are against it.
- Rates of support for democracy have grown closer together over the years since the first survey in 2011.
Figure 10. Longitudinal comparison of respondents’ agreement with the statement “Democracy, despite its shortcomings, is better than other systems”
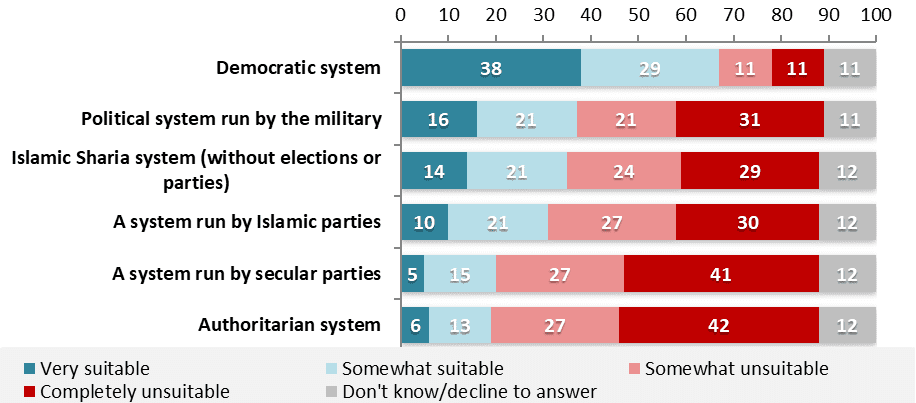
- The majority of respondents (67 percent) believe that democracy is more suitable for their countries than other systems of governance. A majority also rejects authoritarianism, military regimes, competitive systems restricted to certain parties (whether Islamist or secular), and theocratic systems without elections or political parties.
Figure 11. Respondent perspectives on the suitability of certain political systems for their countries
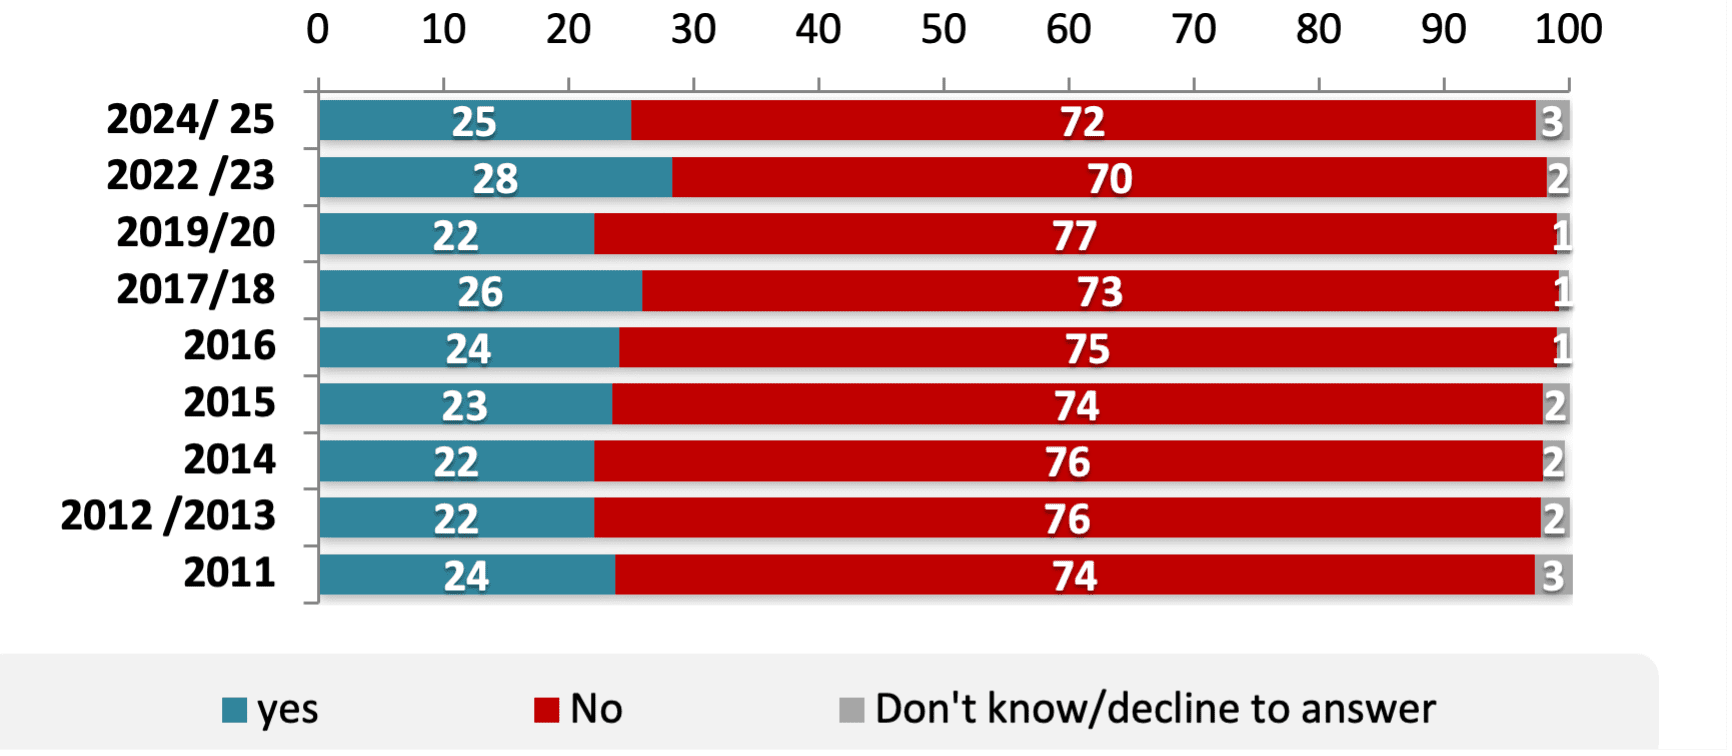
- Fifty percent of respondents in the Arab region would accept the rise to power of a political party with whom they disagree through the ballot box, compared to 41 percent who said that they would not accept that. The highest rates of acceptance were recorded in the Nile Valley and the Maghreb and the lowest in the Mashreq.
Figure 12. Longitudinal comparison of responses to the question “Would you accept a political party with whom you disagree taking power through free and fair elections?”
How do Arab citizens evaluate democracy in their countries?
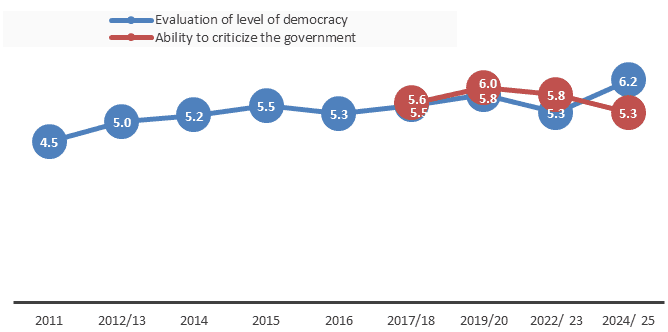
- Respondents rated the level of democracy in the region at 6.2 out of 10 – that is, democracy remains, as far as they are concerned, only halfway achieved. This was higher than the percentage recorded in the 2022/2023 survey.
- Respondents’ perceived ability to criticize their governments appears limited, with an aggregate level of 5.3 out of 10.
Figure 13. Longitudinal comparison of respondent evaluations of the level of democracy in the countries surveyed and the ability of citizens to criticize the government
- Arab public opinion is divided on the matter of separating religion from politics; 42 percent support the separation of religion and politics, while 47 percent oppose it. This split has remained virtually unchanged since 2011.
Section IV: Civic and Political Participation
Although Arab citizens support the democratic system based on a substantive understanding of what democracy is, their civic and political participation is limited. To clarify this point, the AOI tested indicators to measure the degree of political involvement, namely: the extent of citizens’ interest in political affairs in their countries, the extent of citizens’ confidence in political parties, and citizens’ intention to participate in the next elections.
Interest in political affairs and following political news
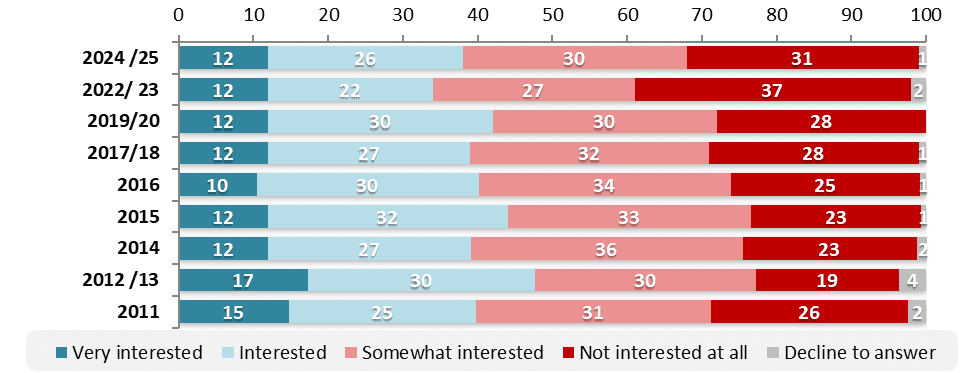
- Arab citizens’ interest is divided over the political affairs of their countries. Notably, there has been an increase in rates of interest in politics (by 7 percent), whereas the proportion of those reporting that they are completely uninterested dropped by 6 percent relative to the 2022/2023 survey.
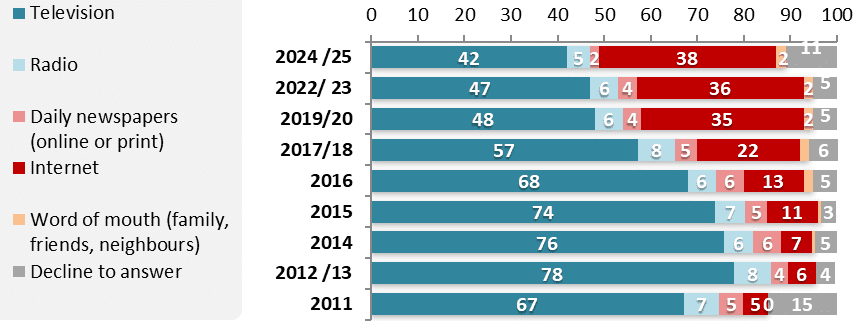
- The results of the past nine surveys have revealed fundamental shifts in the sources on which Arab citizens rely to obtain political news. Reliance on the internet has increased, whereas dependence on television has decreased.
Figure 14. Longitudinal comparison of the extent of respondents’ interest in politics in their countries
- Thirty-eight percent of respondents, the highest rate since 2011, indicated that they rely on the internet to follow political news, representing more than a sevenfold increase in that period. Conversely, rates of reliance on television have gradually decreased over the years. Eighty percent of respondents said that they rely on television and the internet to follow political news.
Figure 15. Longitudinal comparison of most used media for following political news
To what extent do Arab citizens participate in civic organizations and political parties?
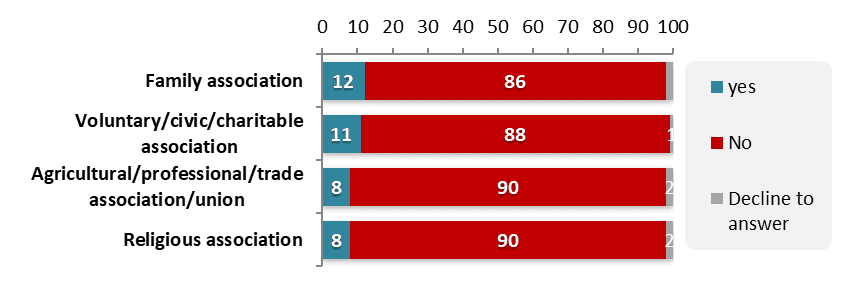
- Membership and participation in civic and voluntary organizations remain extremely limited across the Arab region, with no more than 11 percent of respondents reporting that they are members of such groups in any given country. As for the level of participation in the activities of such groups, it will likely fall further still.
- Affiliation with family associations and organizations is still higher than affiliation with civil, cultural, and voluntary associations.
Figure 16. Respondents participating and not participating in certain civic and voluntary associations
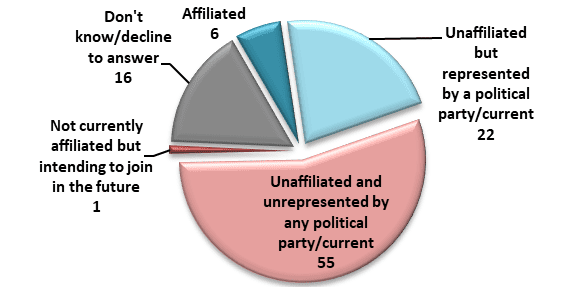
- Just 6% of respondents reported being affiliated with political parties (asked in countries where political parties exist), while a majority of respondents (55 percent) have no affiliation with a political party in any way nor do they feel that their views are represented by any existing political group or bloc. Additionally, 60% reported having no confidence in political parties, compared to 23% who do.
Figure 17. Representativeness of political parties and movements
- Public opinion is divided on voting in the next elections; the percentage of respondents intending to vote has mostly declined since 2011, when 61 percent reported an intention to vote, to just 45 percent in this survey.
- Although Arab public opinion favors democracy, political apathy is clearly prevalent. This may be expected in the context of limited political participation and given that available opportunities to participate in or influence the political system are not convincing to Arab citizens.
Section V: Gaza, Lebanon, Sudan, and Syria
In keeping with now established tradition, the AOI continued developing questions tailored to current affairs. In this context, it allocated a set of special questions to countries undergoing transitions or facing crises and conflicts.
A look at public opinion among Palestinians in Gaza
The following is a glimpse into the dire humanitarian situation faced by residents of the Gaza Strip during the war, as revealed by respondents to a field survey conducted in March 2025.
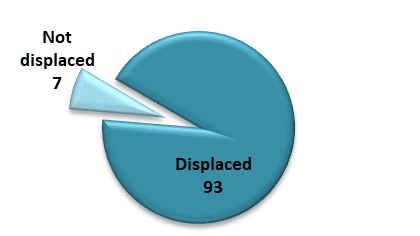
- Ninety-three percent of respondents reported being displaced from their homes once or more during the war.
Figure 18. Percentage of Palestinians Gaza forcibly displaced since the start of the war
- Forty-eight percent of respondents indicated that they were living in a house (either intact or damaged), while 24 percent said they were living in tents, and 13 percent in a public building.
Figure 19. Where Gaza Residents Are Living
| Type of Accommodation | % |
| House (intact or damaged) | 48 |
| Tent | 24 |
| Public Building / School / Institution / Business | 13 |
| Abandoned or unfinished building | 6 |
| Garage / warehouse / depot | 6 |
| In the street / public spaces | 2 |
| Workplace | 1 |
| Total | 100 |
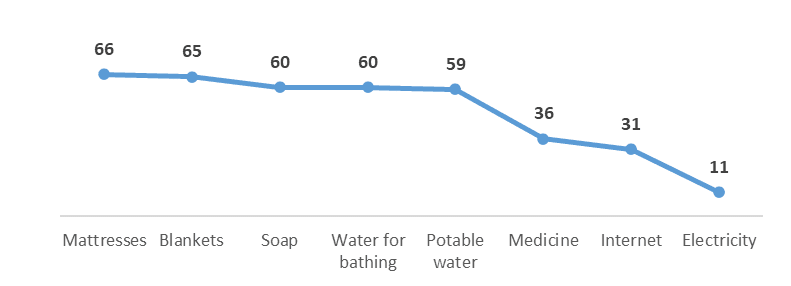
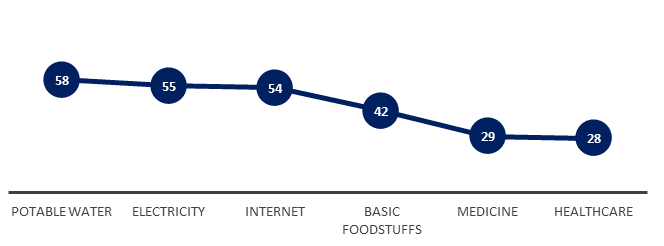
- Sixty to 66 percent of respondents stated that they had mattresses, blankets, soap, or water for bathing. Electricity, internet access, and medicine were available to only 11 to 36 percent of respondents, meaning 64 to 89 percent of respondents lacked these essential services.
Figure 20. Percentage of Gaza respondents indicating that certain basic needs were available most of the time, sometimes, or rarely
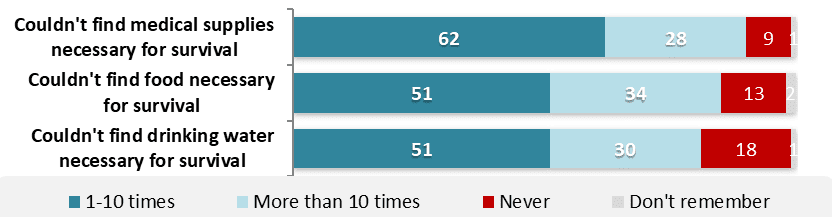
- Ninety percent of respondents indicated that they had needed medicine or medical supplies for themselves or a family member during the war but had not been able to find them. Eighty-five percent reported that they or a family member had experienced hunger multiple times during the war, while 81 percent said that they or a family member had been unable to find drinking water on several occasions.
- Forty-six to 57 percent of respondents indicated that they witnessed multiple instances of people begging for food or water.
Figure 21. The experiences of Gaza respondents or their families in obtaining basic needs during the war
A Look at Lebanese Public Opinion
The AOI included a set of questions for Lebanese respondents about their situation during the Israeli war and ongoing aggression against Lebanon. The survey was conducted in Lebanon in February 2025.
- Ten percent of respondents in Lebanon reported that a family member had left Lebanon as a result of the war.
- Seventy-six percent of respondents from areas targeted by Israel (southern Lebanon, the southern suburbs of Beirut, etc.) stated that they had been forced to flee during the conflict. Of these, 54 percent said that they fled because nearby homes were bombed and destroyed, while 19 percent reported that they had fled because parts of their own homes had been bombed and destroyed. Sixteen percent indicated that their displacement was due to threats from the Israeli army. Eighty-eight percent said that they felt that the area to which they had fled was welcoming.
Figure 22. Lebanese respondents who reported that various services were available to them most of the time, sometimes, or rarely
A look at Sudanese public opinion on the war
The following is a select summary of Sudanese respondents’ experiences of the ongoing armed conflict in Sudan, which began on April 15, 2023, and the resulting humanitarian and social impacts on broad swathes of the population. The survey was conducted inside Sudan in November 2024.
- Forty-seven percent of respondents reported being displaced, either individually or with some or all of their families, since the outbreak of the conflict.
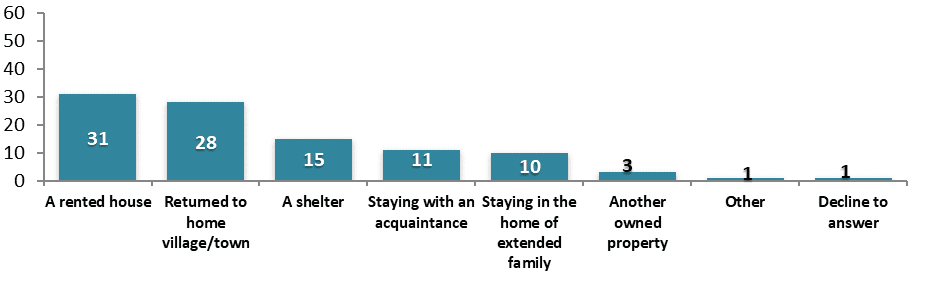
- Thirty-four percent of those displaced indicated that they had been able to return to their homes, while 66 percent reported not having returned as of the time of the survey. Of the latter, 38 percent stated that they were staying in extended family homes or with relatives, 31 percent said that they were renting other accommodation, 15 percent were residing in shelters, and 11 percent were staying with acquaintances.
Figure 23. Where are displaced Sudanese living now?
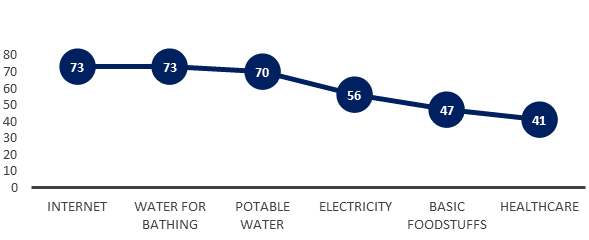
- Regarding the availability of certain services, 58 percent of respondents indicated that potable water was available, while 45 percent indicated a lack of access to electricity and 58 percent a lack of access to food supplies.
- 71% reported that they were unable to obtain necessary medications, while 72% indicated that they did not have access to healthcare when needed.
Figure 24. Percentage of Sudanese respondents reporting that various services were available most of the time, sometimes, or rarely
- Thirty-four percent of Sudanese respondents reported their property had been stolen, 89 percent of whom said that the RSF were responsible for such theft. Twenty-three percent said their home had been raided. A further 18 percent said their homes had been occupied.
- Seventeen percent of Sudanese respondents said they or a member of their family had been attacked, compared to 82 percent who said they had not. Of those who reported being attacked, 94 percent said the Rapid Support Forces were responsible, while 3 percent blamed the army. Meanwhile, 9 percent had been detained, 4 percent had faced sexual assault. All the respondents who had been subjected to these crimes were able to identify the perpetrator.
Figure 25. Percentage of Sudanese respondents saying they or a family member had been a victim of specific crimes since the start of the war, and the perpetrator.
| Have you or members of your family experienced…? | Who was the perpetrator? | ||||||
| Yes | No | Declined to answer | RSF | Army | Other | Declined to answer | |
| Theft of Property | 34 | 66 | 0 | 89 | 2 | 7 | 2 |
| House Raid | 23 | 77 | 0 | 95 | 1 | 0 | 4 |
| Occupation of House | 18 | 81 | 1 | 97 | 1 | 0 | 2 |
| Attack by factions in battle | 17 | 82 | 1 | 94 | 3 | 0 | 3 |
| Arrest | 9 | 90 | 1 | 82 | 16 | 0 | 2 |
| Sexual assault | 4 | 95 | 1 | 86 | 5 | 0 | 9 |
A look at Syrian public opinion
The 2025 Arab Opinion Index included the first-of-its-kind public opinion poll in Syria from July 25 to August 17, 2025, following the fall of the Assad regime, covering a wide range of variables. The following are some selected findings.
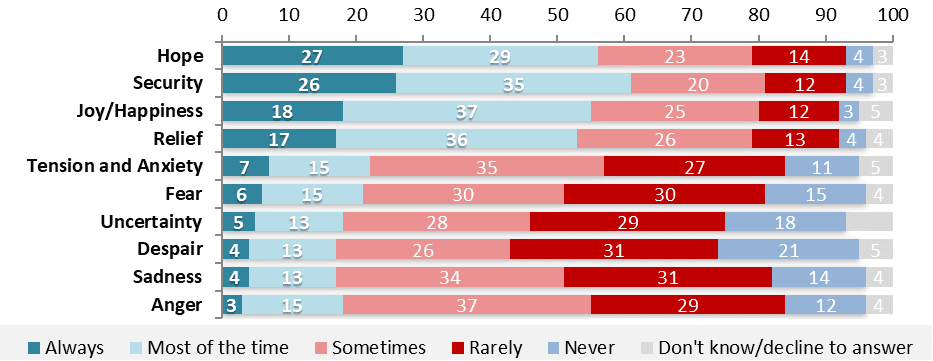
- Between 53 percent and 61 percent of Syrian respondents expressed positive feelings of hope, joy, happiness, security, and relief at the fall of Bashar al-Assad’s regime, while a lower percentage of no more than 22 percent expressed negative feelings like anxiety or uncertainty.
Figure 26. Measuring sentiment among Syrian respondents since the fall of Bashar al-Assad’s regime
- Regarding general conditions in their country, Syrians reported that the most pressing problems facing their country are related to the economic situation, security, political stability, and national unity.
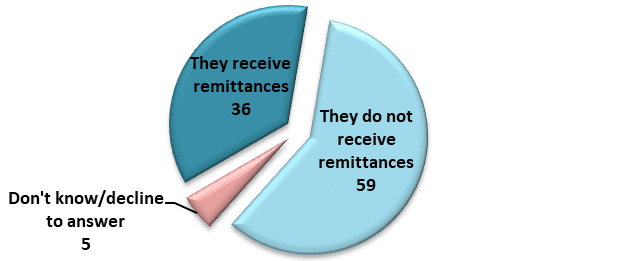
- Thirty-six percent of respondents reported that their families rely on remittances from abroad, both regular or irregular.
- Only one percent of Syrians eat meat daily, while 16 percent reported eating it a maximum of three times a week. Eighty-nine percent reported eating it once a month.
Figure 27. Distribution of Syrian respondents according to whether their families receive monthly remittances from abroad
- Public opinion regarding a range of basic services in Syria was largely negative. Fifty-four percent of respondents rated the availability of food as “good,” while less than a third said the same about the availability of healthcare, internet, water, and electricity.
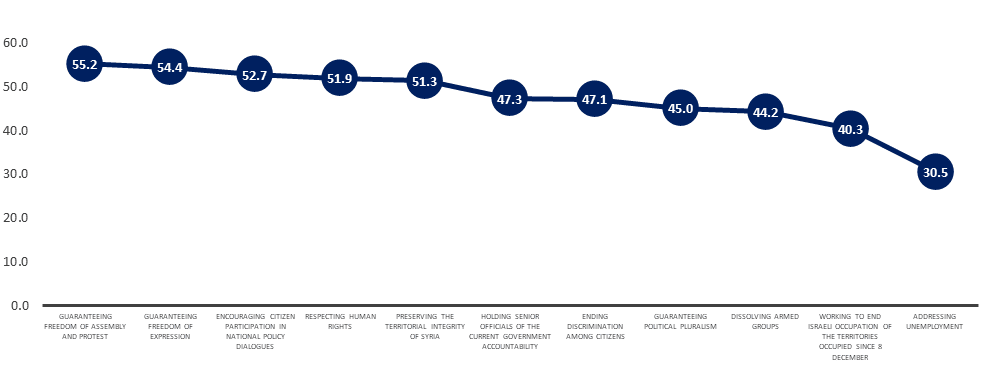
- More than half of respondents rated the government’s performance as “good” with regard to guaranteeing freedom of expression, respecting human rights, and preserving territorial integrity. However, the majority expressed a negative assessment of the government’s performance concerning ending discrimination among citizens, guaranteeing political pluralism, and disbanding armed groups.
Figure 28. Percentage of Syrians rating government performance on certain principles as “good”
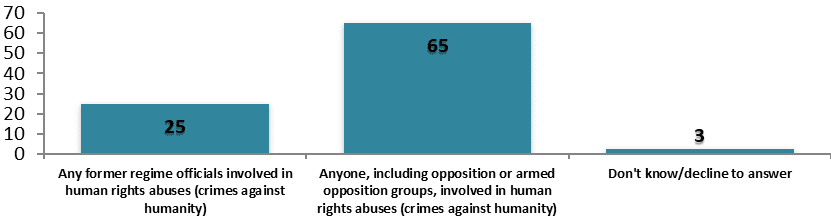
- Sixty-five percent of respondents support holding accountable anyone involved in human rights violations, even those who belong to the opposition to the Assad regime.
Figure 29. Syrians’ views on who should be held accountable for the sake of transitional justice (%)
- Syrian public opinion supports the establishment of political parties in the country, including Syrian national political movements and Islamist movements. The largest group of respondents supported the presence of Arab nationalist and liberal civil movements.
- Regarding the type of state Syrians want, 42% support a civil state, compared to 28% who support a religious state.
- Seventy percent of respondents reported that “sectarian discourse” is widespread or somewhat prevalent in the country.
Figure 30. How Syrian respondents see the prevalence of sectarian discourse and discrimination in the country today
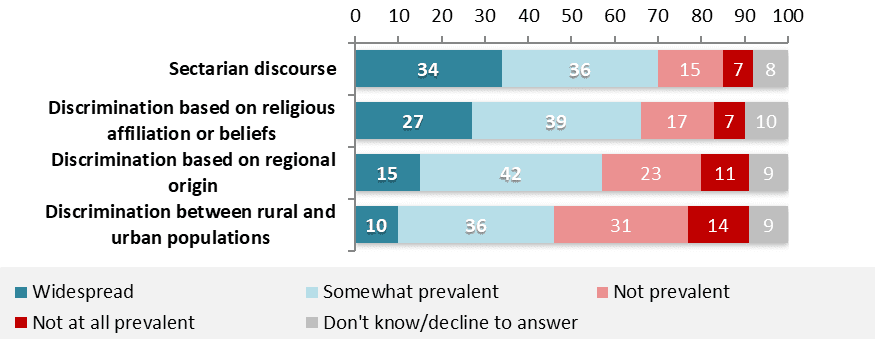
- Eighty-four percent believe that people in Syria today categorize themselves and others based on sect and religion, while 66 percent of respondents believe that discrimination between people based on their sects and religions is widespread in the country
- Forty-one percent of respondents believe that tension between citizens based on sect or religion is the result of foreign interference, while 36 percent believe it is a result of an absence of citizenship and tolerance.
- Although Syrians acknowledged the existence of sectarian discourse, 66 percent of respondents said that they do not differentiate in dealing with others, regardless of their sect or religion; 25 percent expressed a preference to deal with people of the same sect. A majority of respondents (66 to 78 percent) said they would not mind if their neighbours were of other religions, sects, and ethnicities; this reflects a rejection of discrimination.
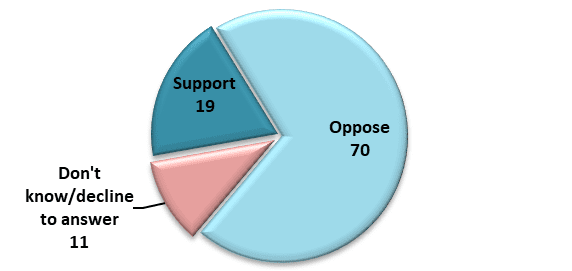
- Seventy percent of respondents oppose an agreement with Israel that does not include the return of the Syrian Golan Heights, and 74 percent believe that Israel “is working to support certain groups in Syrian society in order to fuel separatist conflicts and threaten the unity of Syrian territory.” Meanwhile, 88 percent believe that Israel “is working to threaten security and stability in Syria.”
Figure 31. Do Syrians support an agreement with Israel that does not include the return of the Syrian Golan Heights?
Section VI: The Palestinian Cause and the War on Gaza
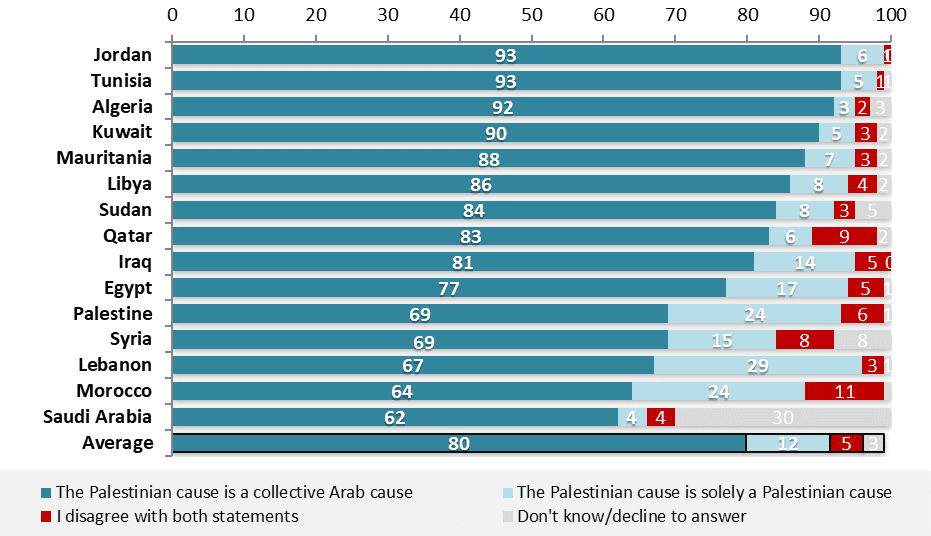
- A large majority of the Arab public (80 percent) believe that the Palestinian cause is a collective Arab cause, while just 12 percent believe it is solely a Palestinian cause. Public opinion in Jordan, Tunisia, Algeria, and Kuwait was highest in considering the Palestinian cause to be an Arab cause.
Figure 32. Longitudinal comparison of attitudes toward the Palestinian cause
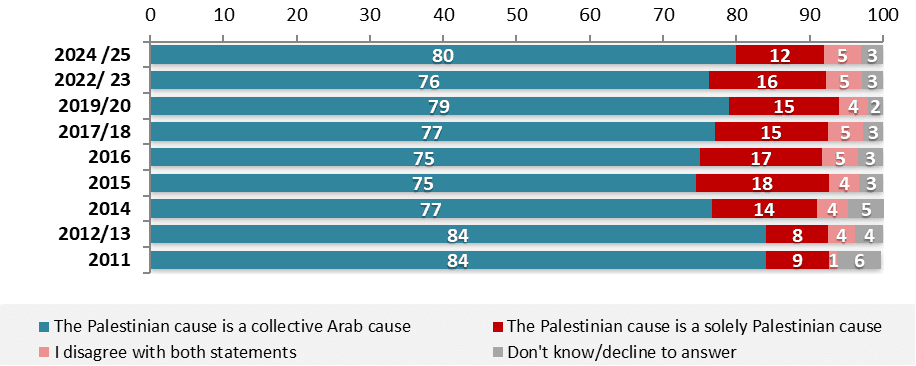
Figure 33. Country comparison of attitudes toward the Palestinian cause
How do Arab citizens feel about recognizing Israel?
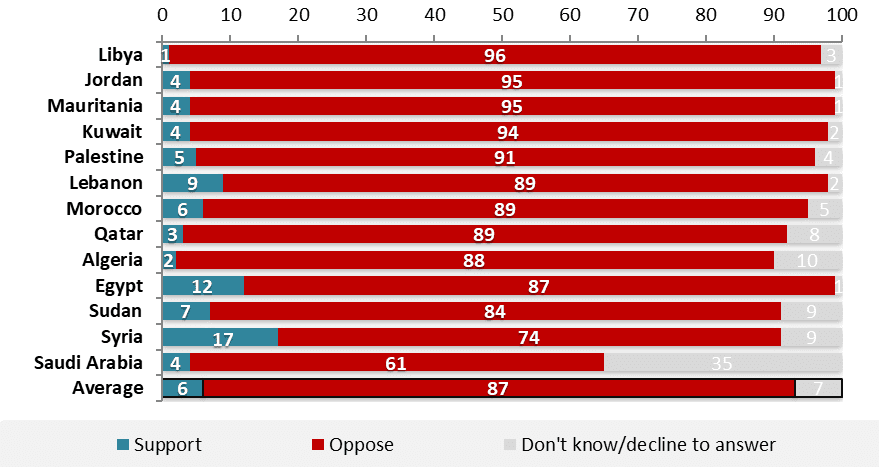
- An overwhelming majority of 87 percent of respondents oppose recognition of Israel, while only 6 percent said they would accept it. Of those who supported their countries recognizing Israel, half made such a move conditional on the formation of an independent Palestinian state.
- Despite the recent normalization agreements with the UAE, Bahrain, Morocco, and Sudan, the percentage of those who supported recognition of Israel dropped by two percentage points in the 2024/25 AOI compared to 2022/23.
- The highest rates of opposition to recognizing Israel were recorded in Libya and Jordan (96 percent and 95 percent, respectively), followed by Kuwait (94 percent), Palestine (91 percent), and Lebanon, and Morocco, and Qatar (89 percent each).
- The results of this survey show significant changes in the opinions of some of the surveyed countries, most notably Sudan, where the percentage of those supporting recognition of Israel dropped to 7 percent after fluctuating between 13 percent and 23 percent in the surveys between 2012/13 and 2022/23. Similarly, the percentage of those supporting recognition of Israel in Morocco decreased from 20 percent in 2022/23, shortly after the signing of the peace agreement, to 6 percent in 2024/25. Meanwhile, the percentage of those who oppose recognition of Israel in Kuwait rose to 94 percent, compared to 85 percent in 2022/23.
Fig 34. Country comparison of Arab opinion on their countries recognizing Israel
- Those who opposed recognizing Israel cited various factors, mainly linked to its colonial, racist, and expansionist nature and its continued occupation of Palestinian territory. Cultural or religious explanations were largely absent. The reasons cited by respondents clearly indicated that their position on recognizing Israel is not likely to change as long as its colonial nature persists.
Figure 35. Reasons cited for opposition to recognizing Israel in AOI polls since 2014
(% of total)
| 2024/25 | 2022/23 | 2019/20 | 2017/18 | 2016 | 2015 | 2014 | |
| Because Israel is a settler-colonial state occupying Palestine | 31.5 | 36.6 | 33.7 | 31.7 | 27.0 | 24.5 | 23.4 |
| Because Israel treats Arabs with racism and hatred | 5.0 | 5.2 | 5.9 | 6.3 | 8.2 | 10.3 | 12.2 |
| Because of Israel’s enmity towards my people and to Arabs in general | 2.7 | 3.7 | 4.1 | 3.4 | 3.3 | 4.7 | 11.5 |
| Because recognition would be a denial of the Palestinians and their rights, and would legitimize what has been done to the Palestinian people | 6.0 | 3.6 | 4.8 | 5.3 | 5.8 | 5.6 | 7.5 |
| Because Israel has exiled the Palestinians and continues to oppress and kill them | 9.1 | 6.5 | 6.8 | 8.3 | 8.1 | 6.9 | 5.5 |
| For religious reasons | 2.3 | 5.1 | 6.7 | 6.6 | 5.2 | 3.3 | 4.9 |
| Because Israel threatens and undermines regional security and stability | 3.0 | 3.6 | 3.6 | 3.4 | 3.2 | 3.4 | 2.5 |
| Because Israel is an expansionist state seeking to dominate or occupy countries in the Arab world and control their resources | 13.3 | 9.0 | 9.4 | 10.1 | 13.0 | 13.0 | 2.4 |
| Because Israel does not respect agreements or treaties | 1.5 | 1.8 | 1.6 | 1.6 | 2.1 | 2.4 | 2.3 |
| Because Israel is a terrorist state that supports terrorism | 6.6 | 7.0 | 7.6 | 7.4 | 7.6 | 10.4 | 1.2 |
| Because Israel has occupied more Syrian territory in recent months | 0.1 | — | — | — | — | — | — |
| Because Israel occupies the Golan Heights | 0.1 | — | — | — | — | — | — |
| There is no state called Israel | 0.3 | 0.2 | 2.3 | 1.1 | 0.6 | 0.3 | 3.4 |
| No reason given | 5.5 | 2.5 | 1.9 | 1.6 | 1.8 | 0.6 | 10.2 |
| Total opposed to recognizing Israel | 87.1 | 84.3 | 88.2 | 86.8 | 85.9 | 85.4 | 87.0 |
| Total agreeing to recognizing Israel | 6.0 | 7.5 | 6.2 | 7.9 | 9.5 | 8.9 | 6.0 |
| Don’t know/decline to answer | 6.9 | 7.9 | 5.6 | 5 | 5 | 6 | 7 |
| Total | 100.0 | 100.0 | 100.0 | 100.0 | 100.0 | 100.0 | 100.0 |
Israel’s War on Gaza
- Respondents saw Israel’s war on Gaza and Lebanon as something that directly affected them, with 87 percent reporting that they felt psychological stress as a result.
- Seventy percent of respondents said they were following news about the war on Gaza, compared to 28 percent who said they were not. The majority of those following the war indicated that their two main sources of information were satellite television (57 percent) and the internet (35 percent).
- When asked in an open-ended question about which country in the world had taken the best stance toward Palestinians during the war, 15 percent of respondents chose South Africa, followed by Spain and Iran, each with seven percent.
- Eighty-three percent of respondents said that South Africa’s decision to bring a case against Israel before the International Court of Justice had boosted their morale. In this context, 70 percent supported the idea that their governments should develop relations with South Africa.
- Eighty-three percent of respondents saw the recognition of Palestine by Latin American and European countries as a positive development.
How do Arabs perceive the policies of international and regional powers toward Palestine?
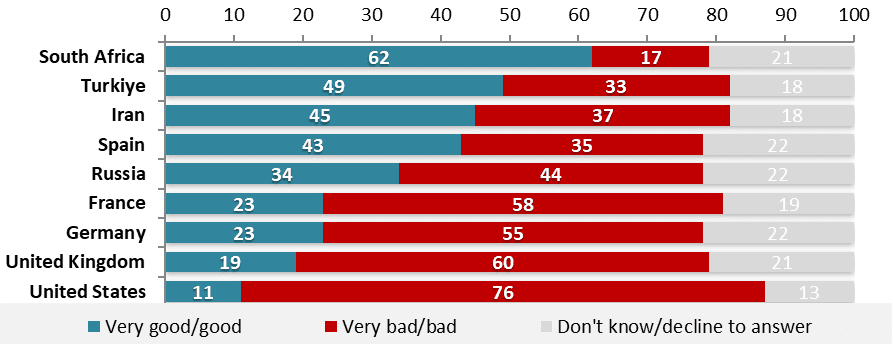
- Respondents were asked to evaluate the policies of various international and regional powers toward Palestine. They generally had a negative view, with less than 50 percent seeing the policies of Iran, Turkey, Russia, the United States, and certain European countries as positive. The sole exception was South Africa; nearly two thirds (62 percent) of respondents agreed that the country’s policy toward Palestine was positive, compared to 17 percent who viewed it negatively. This assessment also indicated that Spanish policy was the most positively viewed among Arab and European countries.
- Public opinion regarding Spanish policy toward Palestine was divided, with 43 percent viewing it positively and 35 percent viewing it negatively.
- Forty-nine percent saw Turkish policy toward Palestine as positive, while 33 percent saw it as negative.
- Thirty-seven percent of respondents had a negative view of Iranian policy toward Palestine, compared to 45 percent who viewed it positively. Respondents from the Mashreq were more likely to have a negative view of Iranian policy toward Palestine.
- When it came to German policy toward Palestine, 55 percent of respondents saw it as negative, while only 23 percent saw it as positive. Twenty-two percent responded “don’t know” or declined to answer.
Figure 36. Evaluating the policies of regional and international powers toward Palestine
- Regarding US policy toward Palestine, a majority of respondents (76 percent) viewed it negatively, compared to only 11 percent who viewed it positively.
- Although public opinion is fairly uniform across the region in its assessment of US policy toward Palestine, citizens of the Mashreq were more likely to view it negatively.
Figure 37. Regional comparison of evaluations of US policy toward Palestine
Section VII: Arab Public Opinion on Intra-Arab and International Relations
How do Arab citizens perceive the Arab nation?
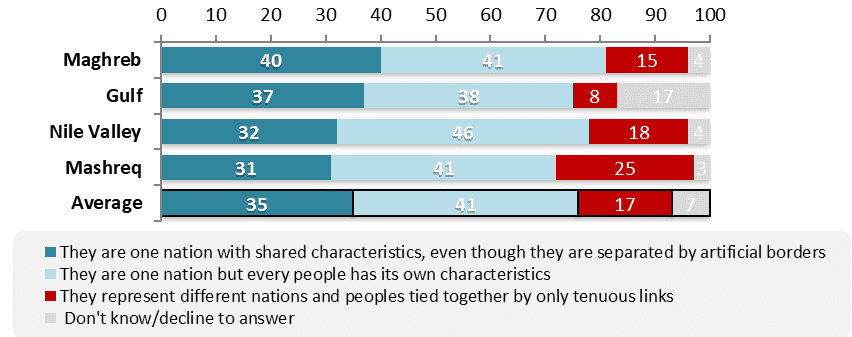
- Seventy-six percent of respondents agreed with the sentiment that the region’s inhabitants formed a single nation, despite distinct characteristics, while 17 percent believe they represent different nations and peoples tied together by only tenuous links. Changes in these percentages over the years have been negligible.
- The highest percentage of those who do not see the Arab people as one nation was recorded in the Mashreq, at 25 percent.
Figure 38. Regional comparison of responses to statements on Arab nationhood among the Arab peoples
Which state poses the greatest threat to the Arab nation?
- Arab public opinion largely agrees that Israel (44 percent) and the United States (21 percent) pose the greatest threat to Arab security. Iran comes in third place with 6 percent. This suggests that Arab public opinion acknowledges the possibility of discussing Arab security and identifying the countries that pose the greatest threat to it.
Figure 39. A longitudinal comparison of the states that pose the greatest threat to the Arab nation
| State that poses greatest threat | 2024/25 | 2022/23 | 2019/20 | 2017/18 | 2016 | 2015 | 2014 | 2012/13 | 2011 |
| Israel | 44 | 38 | 37 | 39 | 41 | 45 | 42 | 52 | 51 |
| US | 21 | 21 | 29 | 28 | 27 | 22 | 24 | 21 | 22 |
| Iran | 6 | 7 | 12 | 10 | 10 | 10 | 9 | 6 | 4 |
| Arab States | 4 | 5 | 5 | 7 | 5 | 5 | 5 | 3 | 2 |
| Russia | 1 | 3 | 1 | 2 | 3 | 1 | — | — | — |
| European States | 2 | 2 | 1 | 1 | 1 | 1 | 2 | 1 | — |
| Other States | 2 | 2 | 1 | 1 | 1 | 1 | 1 | 0.3 | 1 |
| Other | 0 | 1 | 1 | 0 | 1 | 1 | 0.1 | — | 0.2 |
| No threat | 1 | 15 | 2 | 4 | 1 | 1 | 1 | 1 | 0.4 |
| Don’t know/Refused to answer | 19 | 7 | 11 | 8 | 9 | 12 | 17 | 15 | 19 |
| Total | 100 | 100 | 100 | 100 | 100 | 100 | 100 | 100 | 100 |
Threats to the Region’s Security and Stability
- Respondents were asked about the extent to which the policies of certain powers threaten the region’s security and stability. The results showed near-unanimous public opinion, with 84 percent agreeing that Israeli policies threaten the security and stability of the Arab region. A further 77 percent of respondents agreed that US policies threaten the region’s security and stability. This clearly demonstrates that public opinion views Israeli and American policies as the two greatest threats to the region.
- Fifty-three percent of respondents selected Iranian policies and 48 percent identified Russian policies as threats to the region’s security and stability.
Figure 40. Longitudinal comparison of which states respondents believe pursue policies that threaten the region’s security and stability
Section VIII: Public Opinion on the United States
This year, the AOI included a set of questions to gauge public opinion trends toward the United States in general, and the extent of cultural ties with it. The AOI had previously measured this 10 years ago.
- Seventy-three percent of respondents agreed that they have some degree of knowledge about the United States, while 8 percent said they were well-acquainted with it.
- Twenty-four percent indicated that their primary source of information about the United States was traditional media, while 21 percent reported that their sources were the internet and search engines, specifically social media.
- Comparing the results of the 2025 survey with those recorded 10 years prior reveals a qualitative shift in the sources of knowledge about American culture and society: the internet and social media have become primary sources of information about the United States, alongside traditional media.
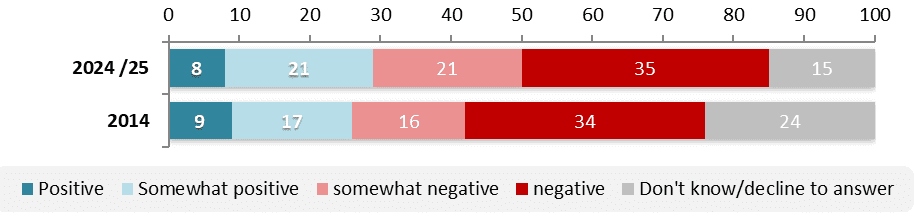
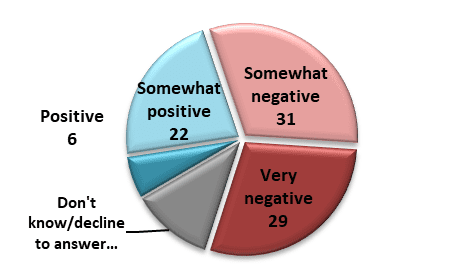
- When respondents were asked about their feelings toward the United States in general, 56 percent expressed negative feelings, a higher percentage than ten years ago.
Figure 41. Longitudinal comparison of how positively respondents describe their feelings toward the United States
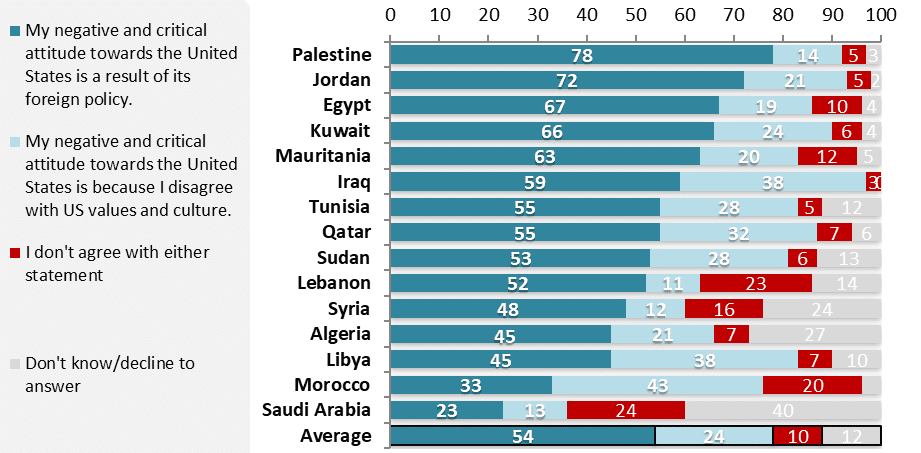
- Fifty-four percent of respondents said their negative view of the United States was a result of its foreign policy and not a disagreement with American values or culture, compared to 24 percent who said their negative view was a result of disagreement with American values and culture.
Figure 42. Country comparison of answers to: “Which of the following statements is closest to your view?”
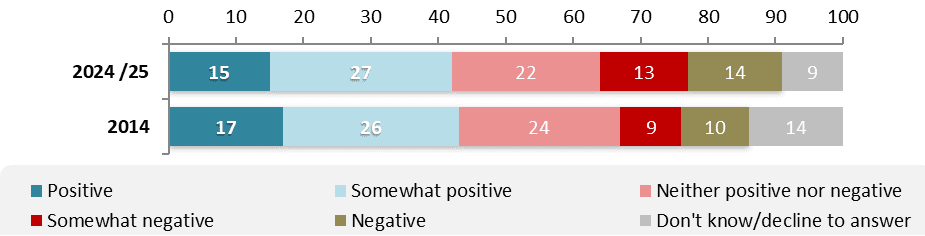
- When asked specifically about the American people, 27 percent of respondents said that notwithstanding US foreign policy, they had a negative view (compared to 19 percent ten years ago), while about half reported that their view of the American public was either positive or neutral when foreign policy was not considered.
Figure 43. Longitudinal comparison of answers to “Putting aside US foreign policy, what is your view of the American people?”
To explore further whether negative attitudes toward the United States were based on factors other than foreign policy (such as culture and values), respondents were asked whether they would choose the United States or another country for specific personal reasons: medical treatment for themselves or a family member; professional training; university studies; working abroad; purchasing imported goods; emigrating to another country and settling there; or taking a vacation.
- The results showed that less than a third of respondents would choose the United States for medical treatment or professional training. A quarter said they would choose American products when purchasing imported goods, and 21 percent said they would choose the United States as a country to which to emigrate. Meanwhile, 14 percent said they would choose the United States for a vacation.
Figure 44. Longitudinal comparison of which activities respondents chose the United States as the best place to undertake
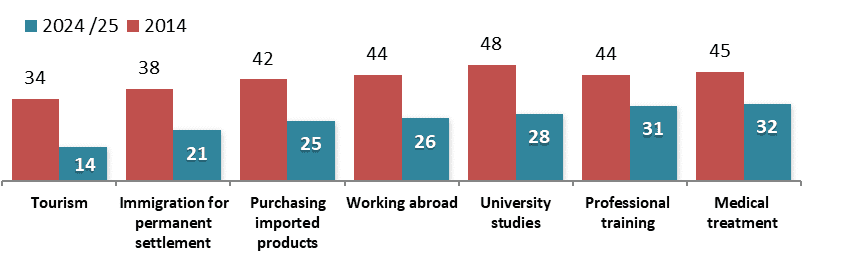
- A comparison of respondents’ choices in the 2025 survey against those recorded 10 years prior shows a clear decline in public opinion regarding the United States versus other countries. The percentage of those who indicated it would be their top choice dropped by approximately 15 to 20 percentage points, reflecting a statistically significant shift in perceptions and a prevailing negative view of the United States as a country, rather than of its foreign policy alone.
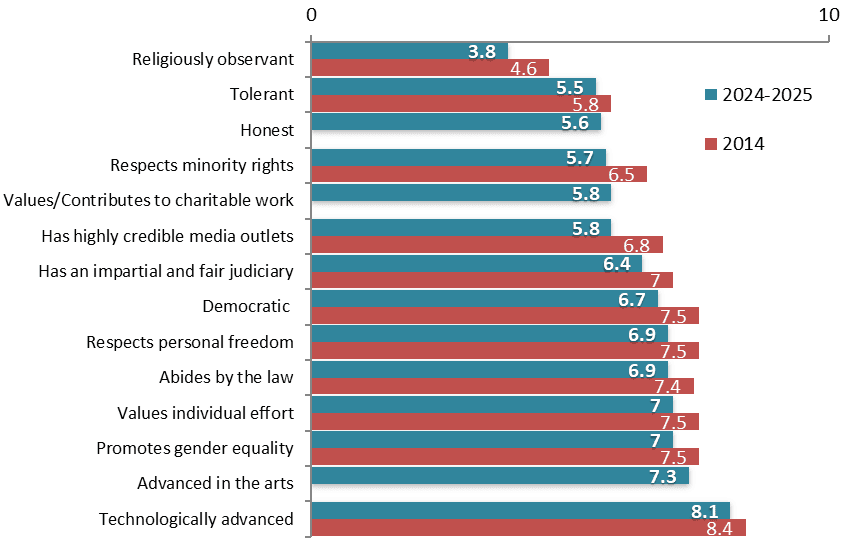
- The results also show that public opinion has become more negative concerning American society; respondents were more negative than previously when asked about a range of positive statements, such as American society’s tolerance, respect for minorities, democratic nature, advanced arts, and appreciation of individual effort.
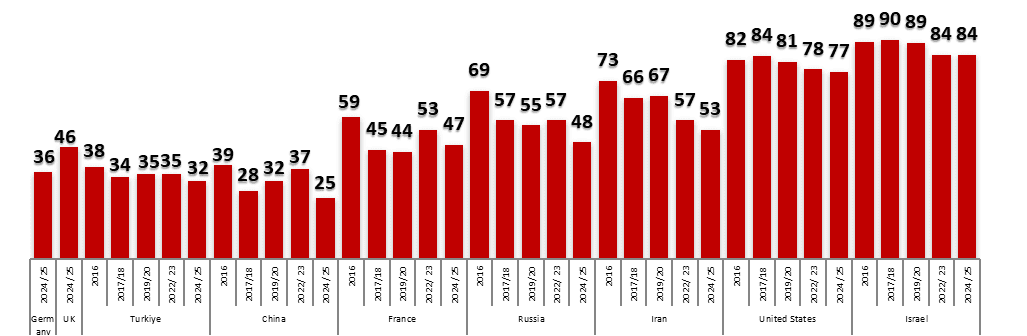
Figure 45. Longitudinal comparison of the extent to which respondents consider the United States as characterized by specific values (1-10). Note: Some questions were not asked in 2014
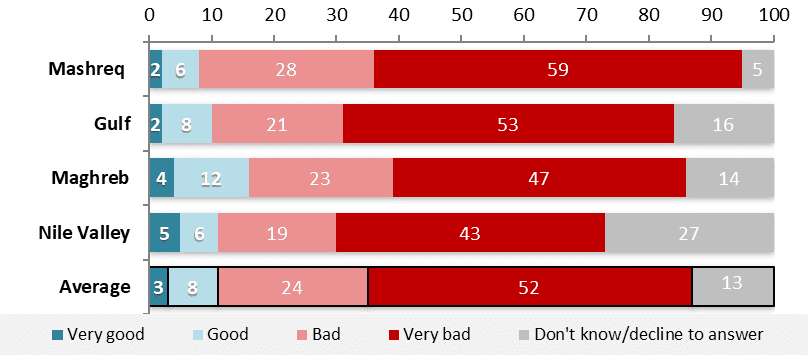
- An assessment of US policies in the Arab region in general, and toward Palestine in particular, indicates that Arab public views these policies negatively. Furthermore, approximately three-quarters of citizens in the region agree that US policies threaten regional stability. Between 50 percent and 66 percent see the United States as attempting to impose its policies on the rest of the world, control Arab countries, exacerbate divisions among them, and favoring undemocratic governments. Fifty-five percent of respondents rejected the claim that the United States protects human rights.
Figure 46. Longitudinal comparison of respondent agreement with proposed statements about the United States
| Agree/ somewhat agree | Disagree/ somewhat disagree | Don’t know / decline to respond | ||||
| 2024/2025 | 2014 | 2024/2025 | 2014 | 2024/2025 | 2014 | |
| The US seeks to dominate Arab countries | 66 | — | 20 | — | 14 | — |
| The US seeks to impose its policies on the rest of the world | 62 | 63 | 26 | 24 | 12 | 13 |
| The US exploits its foreign aid to impose its own agenda | 63 | 64 | 23 | 22 | 14 | 14 |
| The US exacerbates divisions among Arab states | 61 | — | 24 | — | 15 | — |
| US policies contribute to increasing terrorism in Arab countries | 58 | 50 | 26 | 30 | 16 | 20 |
| US fuels sectarianism, ethnic divisions, separatism in the Arab world | 58 | 54 | 23 | 25 | 19 | 21 |
| The US helps spread financial corruption in the Arab world | 55 | 52 | 28 | 28 | 17 | 20 |
| US prefers dealing with undemocratic governments in the Arab world | 50 | — | 29 | — | 21 | — |
| The US protects human rights in the Arab world | 31 | 34 | 55 | 49 | 14 | 17 |
- Forty-four percent of respondents agreed that a change in US policies toward Palestine (such as protecting Palestinians from Israel and halting financial and military support to the latter) would improve their view of the United States.
Figure 47. Longitudinal comparison of responses to “Which of the following decisions, if it were implemented, would improve your view of the United States?”
| 2024/2025 | 2014 | |
| Halting material and military support for Israel | 17 | 26 |
| Protecting Palestinians from Israel | 14 | — |
| Bringing about a just resolution to the Palestine question | 13 | 35 |
| Not interfering in our country’s internal affairs | 10 | 6 |
| Treating the Arab people with dignity and respect | 9 | 3 |
| Helping solve the fundamental challenges our countries face | 4 | 2 |
| Increasing economic aid to the region | 3 | 4 |
| Halting support for autocratic and undemocratic Arab regimes | 3 | 4 |
| Working to end the Iranian nuclear programme | 3 | 2 |
| Working to resolve the Syrian crisis in a way that meets the aspirations of the Syrian people | — | 6 |
| Boosting humanitarian aid to needy and crisis-hit areas of the Arab world | — | 1 |
| Reaching an agreement with Iran over its nuclear programme | — | 1 |
| My opinion of the US will not improve regardless of what it does | 9 | — |
| Don’t know/decline to respond | 15 | 10 |
| Total | 100 | 100 |
- The negative assessment of US policies in the Arab region, and toward Palestine in particular, has significantly altered public opinion toward the United States more fundamentally. It has also resulted in a less positive view of American society and a decline in Arab citizens’ preference for the United States even in areas where it is known for being advanced, such as medicine, education, and training.
- When asked how Western publics, including the American public, views Arabs, 60 percent said it was a negative view, while 28 percent said it was positive.
- When asked about the reasons for this negative view, 25 percent cited religious reasons, 20 percent said it was the result of organized campaigns to disparage Arabs, while 14 percent blamed bad or offensive actions by Arabs themselves.
Figure 48. Respondent answers to “In your view, do western publics have a positive or negative view of Arabs?”
Section IX: Internet and Social Media
To what extent is the internet used in the Arab world?
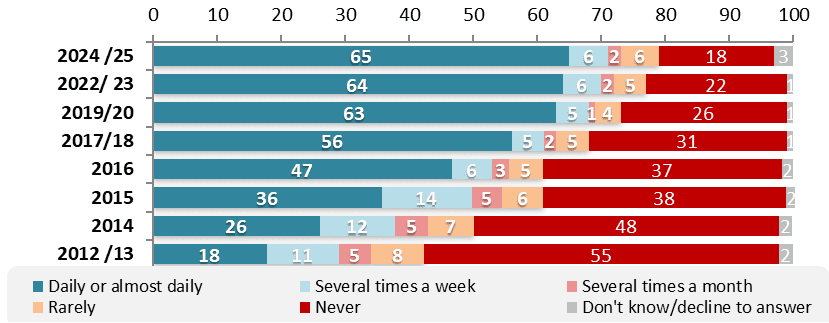
Only 18 percent of respondents reported that they do not use the internet, compared to 79 percent who said that they use the internet to varying extents. Sixty-five percent of respondents reported that they use the internet daily or almost daily. Internet use has seen a statistically significant increase when comparing this year’s survey results with past rounds. The rate of those who do not use the internet has decreased from 55 percent in 2013 to 18 percent in 2025.
- Ninety percent of users report that they browse the internet in Arabic, showing that use of Arabic has risen compared to previous surveys. Web users rely primarily on mobile devices to access the internet, followed by computers. Ninety-eight percent of internet users reported that they have accounts on social media applications and platforms.
Figure 49. Longitudinal comparison of internet use
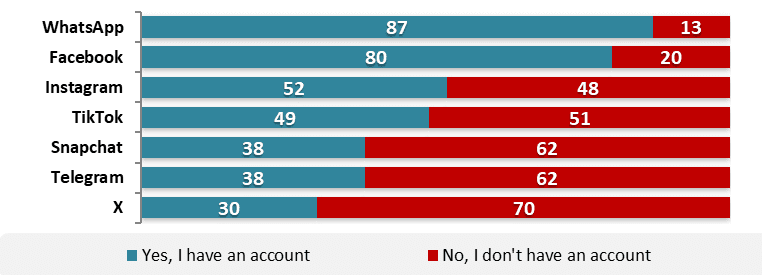
- Despite variation in rates of social media account use, most respondents who have accounts across all regions have WhatsApp and Facebook. Less than half have X accounts, apart from the Gulf countries where 69 percent of internet users reported they have accounts on the platform.
- Nearly half of social media users (47 percent) prefer to receive content in video form, compared to 27 percent who prefer text and 15 percent who prefer photos.
Figure 50. Respondents with various social media accounts out of total internet users
- Twenty-seven percent of social media users reported that they use it to communicate with friends and acquaintances, followed by 15 percent to follow the news in their countries and 11 percent to fill free time.
- In terms of the topics respondents prefer to follow, 13 percent of social media users reported that they use it to follow news and political topics, compared to 14 percent to keep up with trends and social issues.
Figure 51a. Reasons for using social media.
| Reasons | % |
| To connect with friends and acquaintances | 27 |
| To keep up with local news | 15 |
| To fill free time/entertainment | 11 |
| To follow content that interests me | 9 |
| To keep up to date with trending topics | 9 |
| To follow global news | 8 |
| To share my daily activities with friends | 7 |
| To meet new people | 4 |
| For work or to promote my field | 4 |
| To share my opinions | 3 |
| To become an influencer | 1 |
| Other | 0 |
| Don’t know/Decline to answer | 2 |
| Total | 100 |
Figure 51b. Preferred topics to follow on social media.
| 2024/ 2025 % | 2022/ 2023 % | |
| Social media trends | 14 | — |
| Political content | 13 | 18 |
| Social content | 10 | 25 |
| Religion and prayers | 10 | 5 |
| Sports | 9 | 8 |
| Educational/informational content | 7 | 2 |
| Cooking | 6 | 7 |
| Health | 5 | 2 |
| Listening to music | 5 | 13 |
| Fashion and style | 4 | 2 |
| Celebrity news | 4 | 4 |
| Commercial advertisements and promotions | 3 | 2 |
| Art (theatre, painting, poetry) | 3 | 4 |
| Beauty | 3 | 1 |
| Crime and mystery | 1 | 1 |
| Decline to answer | 3 | 5 |
| Total | 100 | 100 |
- Forty-one percent of social media users said that they trust the information and news circulated on social media, compared to 59 percent who said they do not. This indicates a decrease in trust in information and news circulated on social media compared to the two previous AOI rounds.
Figure 52. Longitudinal and regional comparison of social media user trust in the news and information circulating on it
- The lowest levels of trust, 32 percent, were recorded for news and information circulated by influencers and celebrities on their personal pages.
- Fifty-six percent of social media users trust the news and information published on official government social media pages, whereas trust in news published on other types of pages is below 50 percent.
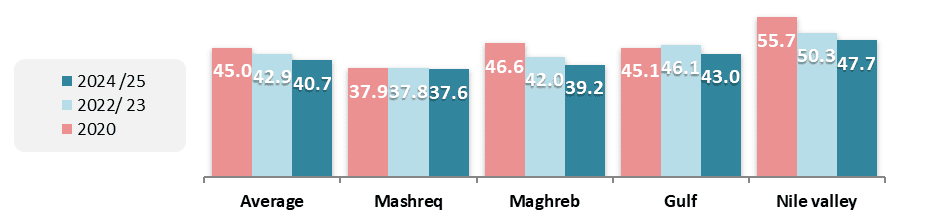
Figure 53: Social media users’ self-reported trust in the news and information published on specific types of platforms (arithmetic mean)
| 2024/ 2025 | 2022/ 2023 | |
| Official government pages | 55.7 | — |
| News TV channel pages | 48.0 | 48.2 |
| Media/journalist pages | 44.1 | 44.3 |
| WhatsApp news groups | 38.9 | 35.5 |
| Facebook newsrooms and groups | 35.4 | 34 |
| Public pages of social media users | 33.7 | 35.1 |
| Influencer and celebrity accounts | 31.8 | 32.6 |
- Fifty-seven percent of social media account holders use these platforms to express their views on political events, with 11 percent doing so daily or several times a day.
- Fifty-four percent reported that they use social media to participate in or engage with political issues, while 42 percent said they do not.
- Saudi Arabia and Jordan are the least likely among Arab societies to use social media to engage with political issues. This pattern is reflected in the Mashreq and Gulf regions, which also record the lowest levels of social-media engagement with political matters.
To what extent do Arab citizens follow and trust social media influencers?
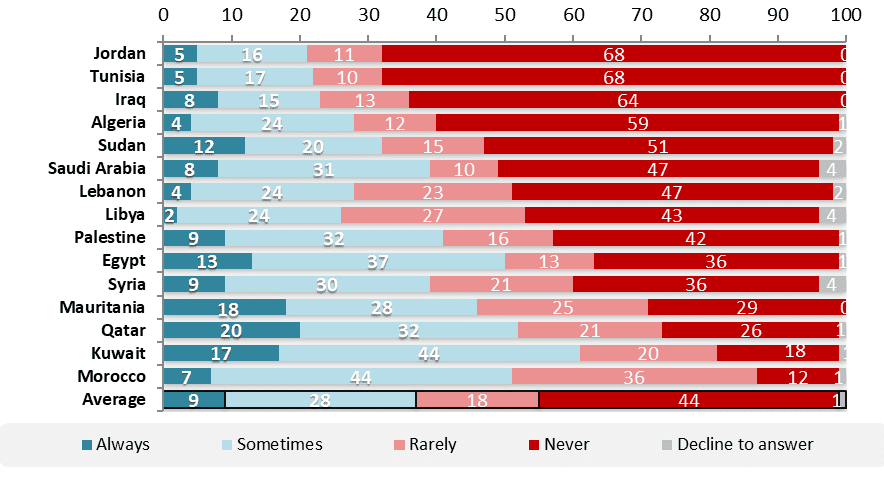
- Half of social media users follow influencer accounts: Nine percent of respondents said they follow influencers regularly, 28 percent follow them occasionally, 18 percent follow them rarely, while about half of social media account holders said they do not follow them at all. Social media influencers are the most followed, then sport influencers, then politics, and finally religions.
- Following influencers does not necessarily translate into trust or influence: 42.9 percent of those who follow influencer accounts said they are influenced by what influencers post, compared with 57 percent who said they are not.
- Fifteen percent of respondents reported being aware of the existence of so-called “electronic armies”, compared to 76 percent who said they were unaware of them.
Figure 54. Followship of social media influencer accounts
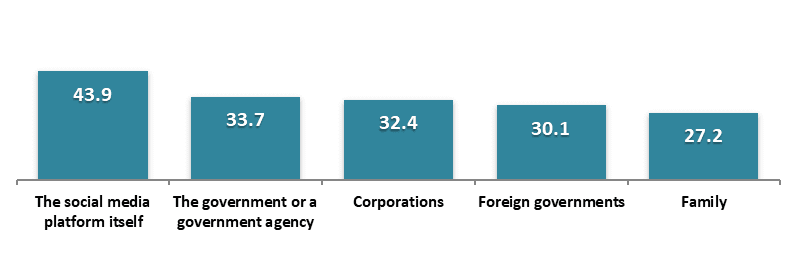
- Thirty-seven percent of respondents with social media accounts believe their social media activity is monitored, while 44 percent believe the platforms themselves monitor them.
Figure 55: respondents with social media accounts who believe their social media activity is monitored
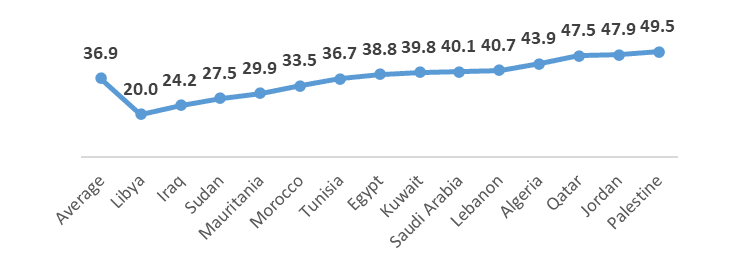
Figure 56. The entity respondents believe is monitoring their social media activity